 March
2001 March
2001 |
|
March
2001 |
| About the Net: Measuring Connectivity Infrastructure |
|
Larry Press In the November 2000 issue of iMP, we discussed the importance of policy makers and researchers having a clear understanding of the state of the Internet in a nation. We surveyed indicators and comprehensive frameworks for characterizing Internet diffusion, including a framework defined by my colleagues and myself at the Mosaic Group.[1] Our goal is a set of commonly accepted and defined indicators and a general framework similar to those used by economists in national income accounting. Our current framework describes the state of the Internet in a nation using six dimensions, and, as in economics, the task is complex. Indicators are difficult to define, and they are often imperfect surrogates for characteristics we wish to measure. We are also hounded by technical progress that increases the capacity of current offerings and makes new options possible. Let me illustrate by looking at one of our dimensions of Internet diffusion, Connectivity Infrastructure. Four years ago, we decided to consider four components in assessing the level of connectivity in a nation: total bandwidth of international links, total domestic backbone bandwidth, the number and type of Internet exchange points, and the adoption rate of high-bandwidth access technology.[2] We assess the level of each of these factors (Table 1) and average them to determine the level of infrastructure development. Four years ago, this procedure seemed reasonable, but much has changed since then. Let's look at changes in the four components of connectivity infrastructure. Table 1. MOSAIC Group Connectivity
Infrastructure Components
The aggregate speed of international links is an attractive indicator since it increases with the progress of the Internet and is relatively easy to measure accurately. There are a limited number of such links to tally, and they are often registered with a regulating agency. However, there is no upper limit to international bandwidth, which is problematical. At the time we established our framework, we set 10 Gbps as the threshold for extensive international bandwidth, but since that time demand and technology have changed markedly. In 1996, shortly before we established our framework, aggregate international bandwidth from Latin America was 3 Mbps. Mexico accounted for roughly half of that, and most connected nations had only 64 Kbps, roughly the speed of a DSL modem.[2] By the year 2000, that figure had grown to 2.84 Gbps,[3] and five undersea cables are currently being deployed that will have an initial capacity of 215 Gbps, upgradeable to 83,435 Gbps![4] While there is nothing inherently unacceptable about a scale in which many nations may exceed the top level and few fall into the lowest category, we would probably have selected different thresholds today or we might wish to use a relative measure in such cases. It also seems reasonable to adjust for population differences, measuring international bandwidth per capita. Domestic backbone bandwidth is even more problematical than international bandwidth. When we defined our framework, the U.S. National Science Foundation Network (NSFNet) was just phasing out. Up to that time, NSFNet had been the only U.S. backbone network, and only a few commercial networks could claim to be emerging as new backbones. It was easy to enumerate them and their intercity links. Today, adding the speed of all backbone links is unfeasible in a developed nation like the United States. Figure 1 shows the links in one of approximately 40 backbones that have been registered with the Cooperative Association for Internet Data Analysis.[5] Registration is voluntary, making this figure a subset of existing links; new links are being added and old links upgraded daily, and many companies are reluctant to reveal network details. Many links operate at 2,488 Mbps today, and we will soon have links capable of 10 Gbps, making our previous level 4 cutoff point seem small. Measurement problems are compounded by our having no widely accepted definition of a "backbone" network. Figure 1. The US Portion of the UUNET
Backbone (colors indicate link speed).
Enumerating all backbone links is unfeasible today, so we must revise and simplify this element of connectivity infrastructure. Perhaps the simplest measure would be to consider the speed of the fastest intercity link in a nation on the assumption that it would be correlated with the speed of others -- at the time one provider moves to a given speed, competitors must be nearly ready to do so. That might exaggerate the development of a nation with a single fast link between two major cities, and sparse connectivity elsewhere, so we might want to also consider the number of backbone networks. Of course that would require a definition of "backbone," perhaps something like "a network providing connectivity to resellers with points of presence (POPs) in at least 25 percent of the political subdivisions (states in the U.S.) of a nation." Another alternative would be to count the percent of metropolitan areas with backbone POPs, though that would require a suitable definition of a metropolitan area.[6] Backbone networks exchange traffic at Internet exchange points, a third indicator. In many cases, these are public, open to any network that meets specified qualifications.[7] Public exchange points are easily enumerable, and, at the time we established our framework, they were most prominent. But, with time, public exchanges became congested, and network operators now often create private, bilateral exchange points. Knowledge of these private exchanges is often proprietary, and many networks even refuse to state the criteria they use in qualifying another network for traffic exchange. Since this component is correlated with other components of backbone development, it is somewhat redundant and should be dropped from the connectivity infrastructure dimension.[8] At the same time as the relative importance of public exchange points has declined, collocation facilities have become important. These are large data centers with high-speed connections to one or more backbone networks, and many Internet and intranet servers reside at these facilities. Colosource, http://www.colosource.com/, lists 761[9] such facilities in their database (see Figure 2 for North America) and Band-X, http://www.band-x.com/, runs an online market for collocation space that currently has 143 offerings. Square feet of available collocation space could be another indicator of connectivity infrastructure in a nation if we could collect accurate data. Figure 2. U. S. Collocation Sites.
Access possibilities have also changed dramatically since we established our framework. We distinguished between home and organizational connectivity. At that time, most home connections were via modem, and for organizations, leased lines from telephone companies, the familiar bundles of voice circuits from 64 Kbps to T1 or T3, were the only game in town. The number of options and their speeds has increased dramatically in a few short years: Home:
Organization:
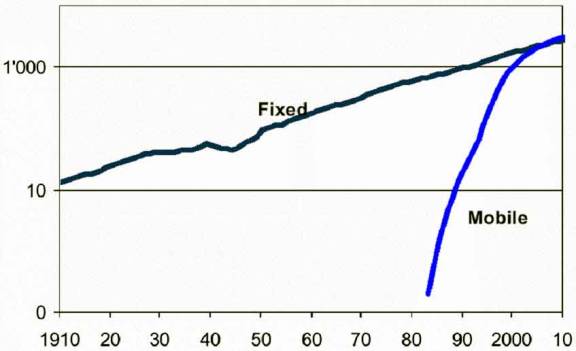
We could adjust our current framework to account for these access technologies, but other factors are more difficult to accommodate. When we defined our framework, it was reasonable to consider three levels of connectivity: international links, domestic backbones, and access networks, but today we see private and public metropolitan area networks taking on increased significance, and many are beginning to talk of and deploy pilot neighborhood area networks.[10] Should we account for the deployment of metropolitan area networks, and, if so, how? We also failed to anticipate mobile access in our initial framework. Today, mobile access is usually (though not always) slow and limited to low-volume, handheld devices; however, that will change in the foreseeable future. Third generation cellular promises seamless global roaming at speeds of 2 Mbps to a fixed location and 384 Kbps in a moving vehicle, starting in Europe and Asia within the next few years. Cellular telephones are expected to outnumber wireline phones within the decade (Figure 3).[11] How are we to measure the state of the access networks when mobile access and access by machines become important factors? Figure 3. Fixed and mobile phone service,
1910-2010
We have used our framework to describe the connectivity infrastructure of 24 nations, but it is beginning to feel a bit frayed around the edges.[12] Technological and market change have resulted in skyrocketing capacities and new options, and we need to adjust our framework accordingly, defining new measures of the state of connectivity in a nation. Our indicators do not have to be perfect, but, like national income indicators, we should seek to measure them regularly and globally. [1] Larry Press, Grey Burkhart, Will Foster,
Seymour Goodman, Peter Wolcott, and Jon Woodard, An Internet
Diffusion Framework, Communications of the ACM, Vol. 41, No. 10, pp
21-26, October, 1998, http://som.csudh.edu/fac/lpress/articles/ [2] For a comparison of the Mosaic framework and others see Bridges.Org, Comparison of E-Readiness Assessment Models, Final draft, v. 2.13, 14 March 2001, http://www.bridges.org/ereadiness/index.html. Return to text [3] Source: Press, Larry, Seeding Networks: the Federal Role, Communications of the ACM, pp. 11-18, Vol 39., No. 10, October, 1996. Return to text. [4] Telegeography 2001, Telegeography, http://www.telegeography.com/. Return to text. [5] LatinCom, page 6-9, October 6 2000, Informa Telecoms, http://www.baskervilleonline.com/. Return to text. [6] http://www.caida.org/tools/visualization/mapnet/. Boardwatch Magazine currently lists 44 North American national backbones, http://www.boardwatch.com/isp/bb/n_america.htm. Return to text. [7] The latter two measures could also be used in the geographic dispersion and organizational infrastructure dimensions of the Mosaic framework. Return to text. [8] For information on many public exchange points, see http://www.ep.net/. Return to text. [9] I would, however, count public IXs in assessing the level of ISP cooperation in the organizational infrastructure dimension. Return to text. [10] As with many Internet indicators, this is skewed toward the U.S., which has 638 of these locations. Return to text. [11] For thoughts on neighborhood area networks, see AirSwitch, http://www.airswitch.com/, the Dandin Corporation, http://www.dandin.com/, and work on high-speed wireless access using software-defined radio, http://www.sdrforum.org/. For optical access, including metropolitan area networks, CANARIE, http://www.canarie.ca/, Canada's advanced Internet Development Organization is an excellent source of ongoing information. Return to text. [12] International Telecommunication Union. Return to text. [13] See http://mosaic.unomaha.edu/gdi.html for those studies. Return to text.
Released: March 22, 2001 (c) 2001. Laurence Press. All rights reserved. |